ECCO 65: ECONOMIC & COMPACT
BEST PRICE-PERFORMANCE 3D SENSOR
The ECCO 65 delivers an entry-level 3D sensor for applications where price and speed are vital, for simple measurement and inspection tasks. It balances cost and performance to provide 3D laser scanning for customers where previously 3D laser scanning was not a commercially viable solution.

Properties & Benefits
ECCO 65.050
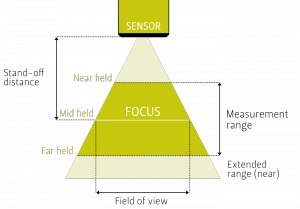
| Typisches Sichtfeld (near | mid | far) 1 | 36| 49| 62 mm |
|---|---|
| Messbereich 1 | 100 mm |
| Stand-off distance | 150 mm |
| Typische vertikale Auflösung (Z) 1 | 5 – 12 µm |
| Typische laterale Auflösung (Y) 1 | 42 – 70 µm |
| Z-Linearität 2, 5 | 0.008 % (0.1 µm/mm) |
| Z-Wiederholgenauigkeit 4, 5 | 0.8 µm |
| Gewicht | Approx. 480 g |
| Teilenummern | 3.005.320 (laser class 2) 3.008.320 (laser class 3R) |

| Maximum points / 3D profile | 960 |
|---|---|
| Typical scan rate 3 | Approx. from 150 Hz up to 5 kHz |
| Typical 3D point rate 3 | Approx. from 0.3 up to 4.8 million points/sec |
| Interface | Gigabit Ethernet ( 1 Gbit/ sec) |
| Inputs | 4 x Inputs, 5 – 24 VDC Quadrature Encoder (AB-Channel, RS-422 Standard) |
| Outputs | 2 x Outputs, 24 VDC |
| Trigger | START Trigger support on Input 1 – 2 DATA Trigger support on Quadrature Encoder Input (Max. DATA trigger rate: 100 kHz) DATA Trigger support on Input 2, 3 (Max. DATA trigger rate: 10 kHz) |
| Input voltage | Power | 24 VDC, ± 15 % ripple | 7.5 W |
| Laser wavelength | 660 nm |
| Laser class (standard | optional) | 2M | 3R |
| Maximum ambient light | 10,000 lx |
| EMC test | as per EN 61 000-6-2, EN 61 000-6-4 |
| Vibration/ Shock test | as per EN 60 068-2-6, -27, -29, -64 |
| Electrical safety | as per EN 61 010-1-3 |
| Protection class | III, as per EN 61 040-3 |
| Enclosure rating | IP65 |
| Air humidity | Maximum 90%, non-condensing |
| Temperature (operation | storage) | 0 – 40° C | -20 – 70° C |
| Compatible accessories | Power-I/O-Encoder cable: 6.320.0XX Ethernet cable: 6.303.0XX |
(1) Typical values can vary up to 5% due to optical tolerances
(2) Z-Linearity calculated as a variation of “bias” (reference value vs. measured value) over the measurement range. The %slope of a best-fit (regression) line from a plot of bias over measurement range represents Z-Linearity
(3) Scan rate & point rate are dependent on the configured field of view, measurement range and exposure time. The typical scan/point rate has been estimated with an exposure time of 1 µsec
(4) Experimentally asessed by scanning a measurement target moving over a conveyor belt 50 times. Measurement perfomed by averaging height values within the Z-Map image. No post-processing filters applied
(5) Measurements performed on a SmartRay standard artifact which is an aluminium flat matt surface painted matte white


